Love Equilibrium Graph .
 Dedicated to my MacroEconomics Lecturer Mr " Sami " & My SunShine ..
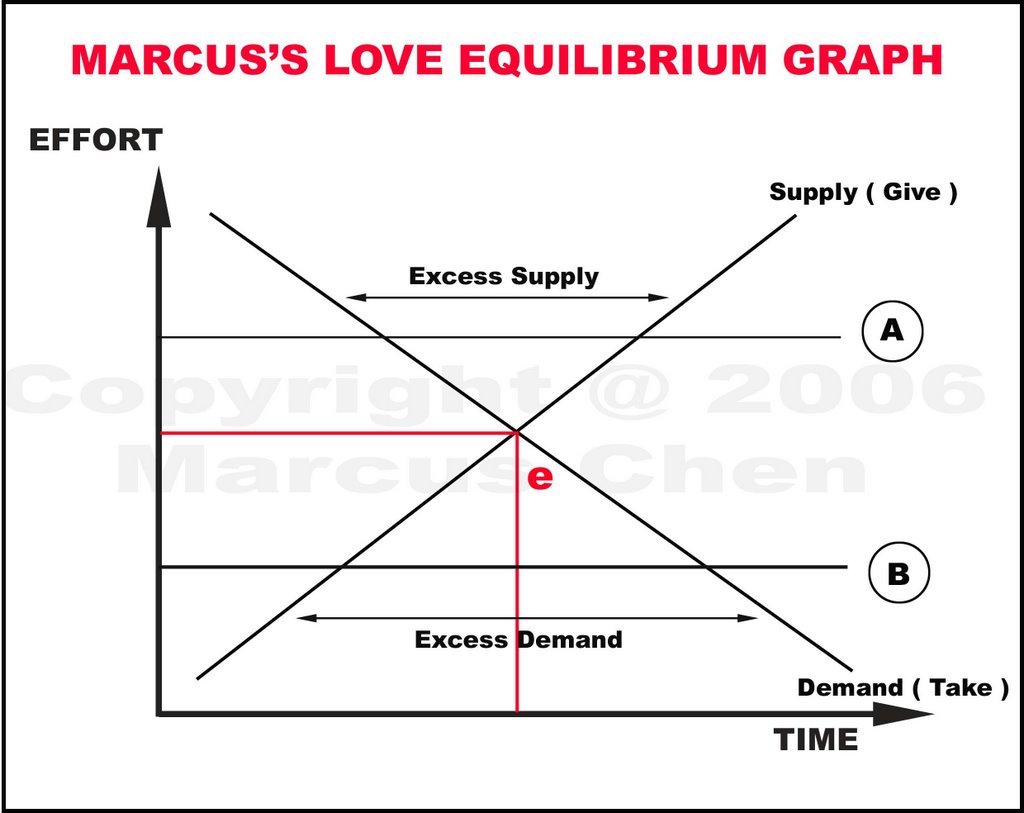
@ Point e , Equilibrium is reached when Supply & Demands are met with the right amounts of both... with the supply ( give ) and Demand ( take ) @ Reasonable amounts which is agreed by both parties. Thus @ Point e , Market Equilibrium is reached & the couple will be happy .
@ Point A , There is no equilibrium. Because The Supply & Demands Curves dont Intersect > ( No Marks ! Ah Neh Lecturer Sami Say one ) .. Cannot like that say ... Must explain the market forces ... Because @ Point A , There is excess supply ( Give ) ... One party of the relationship is giving too much ... So he/she not happy .. how to have Equilibrium ?
@ Point B , There is also no equilibrium , because there is excess demand ( take ) .. one party of the relationship wants more , want this , want that , want everything , but the other party giving is not giving enough ... So Both unhappy .. So no Equilibrium ....
*** Therefore , to achieve perfect equilibrium , both parties must give & take equally , or @ a reasonable amount that both parties are willing to give ... to achieve a happy relationship.
UNDERSTOOD ?? Stood ?? SSssToOot ?? Good ....FULL MARKS !! Exams come out this question i sure score ....
XiaoMaGe Signing out ...
posted by Mambo XMG at Thursday, October 05, 2006
![]()


0 Comments:
Post a Comment
<< Home